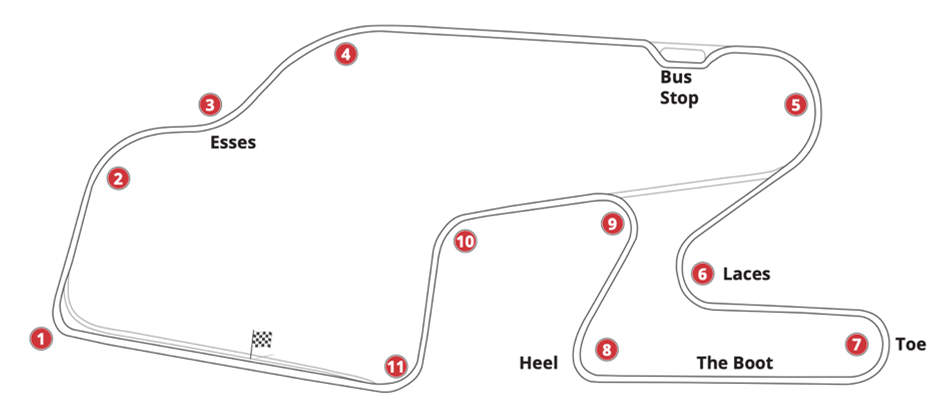
Let me share a coaching story with you, one that took place at Watkins Glen. It will demonstrate how I used one lap’s data to come up with just two strategies for improving a driver’s lap times. The car was a slightly modified production car, and it was during a track day, not a race. The driver had been high-performance driving for a long time, and was considered an advanced, fast driver; he’d been turning consistent laps at the Glen for years, but had plateaued.
I use this example to show you how you can use data to come up with a simple plan for your next track session which can lead to significant improvements. The data I used was simple: a Speed trace (although I did also have Lateral and Longitudinal g traces, they reinforced what I noticed in the Speed trace).
Watkins Glen is one of the most fun and challenging circuits in the world. Because it’s 3.4 miles in length, just a few small changes in driving technique can result in a big improvement in lap time. In fact, in the example I’m sharing here, just two changes led to a gain that many drivers would trade a body part for!
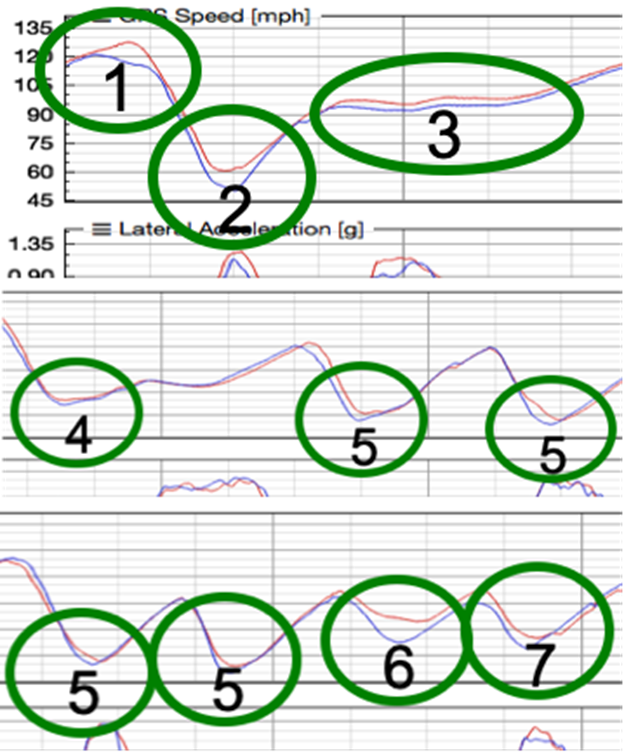
Below is a graph showing the Speed trace (upper line), Lateral g (middle), and Longitudinal g (bottom).
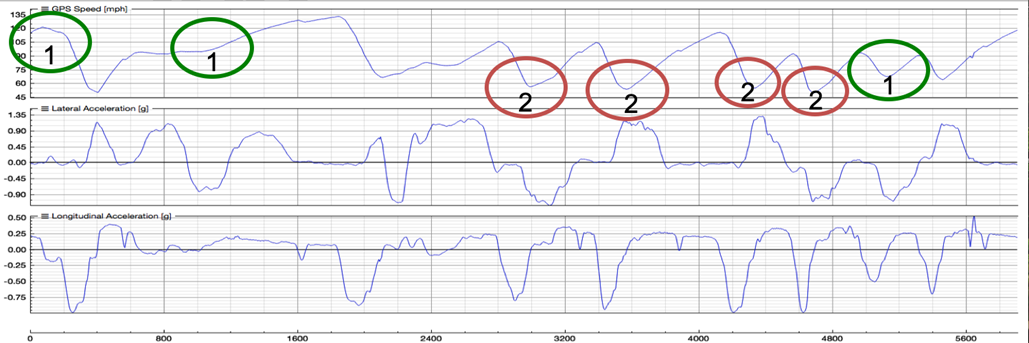
When I looked at this, I immediately noticed two things:
- The areas circled in green hinted at a slow rate of acceleration and/or a large adjustment in speed, which suggested a lack of commitment to full throttle. The first green circle (looking from left to right) shows that the acceleration at the end of the front straight flattens out. That made me think the driver probably eased off the throttle well before beginning to brake. The second green circle is when the car is heading up the hill through the Esses, and the trace suggested that the acceleration rate should have been steeper, possibly meaning the driver was lifting off the throttle a lot. The final green circle showed a large deceleration (Turn 10) before acceleration, and my experience at Watkins Glen suggested it was too much.
- The areas circled in red show a lack of trail braking. If you notice, the Speed trace falls down, abruptly flattens out then slightly inclines — I think of the shape at the bottom as being quite “square.” That indicates little to no trail braking, which often means being unable to get the car to change direction enough to get back to full throttle early.
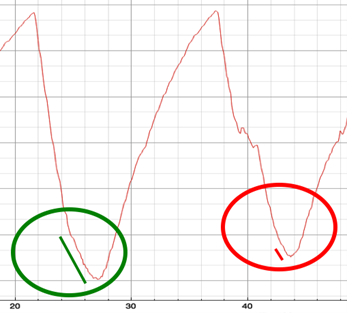
Let’s dig into this trail braking thing a little more from a data perspective. To the right is a zoomed-in Speed trace that shows trail braking. Notice the “hockey stick” shape of the trace inside the green circle below; the change in the rate of deceleration indicates trail braking. The lack of that hockey stick inside the red circle indicates a lack of trail braking. We all know that some corners reward trail braking, and some don’t. But I wondered… if the driver trail braked a little more in some of these corners, would that result in the car rotating better, meaning he could get back to full throttle sooner?
With this in mind, it was time for me give the driver direction for the next on-track session. From the data, I wanted the driver to focus on just two things:
- More time at full throttle.
- Use the brake release to help carry entry speed, get the car to rotate, and ultimately get back to full throttle sooner.
I then asked the driver to do the following in the next on-track session (ideally, I would have split this up over two sessions, but the driver only had one session left that day, so I took a chance that he’d be able to handle it all in one session):
- “Spend 3% more of the lap at full throttle.” (Note, I wasn’t asking for a big change.)
- “Experiment with the timing & rate of release of the brakes – focus on Turns 6, 7, 8, 9.”
Both sessions were aimed at getting the driver to simply be more aware of his driving technique, the amount of time spent at full throttle, and when and how he released the brake pedal when entering corners. I didn’t actually tell him what exactly to do, although we did spend a few minutes talking about how a driver could spend 3% more of a lap at full throttle (stay at full throttle slightly longer before braking, get back to full throttle earlier in corners, and get to full throttle in between corners where it’s easy to get in the habit of only going to part throttle).
Below is the data overlay comparing the original lap (in blue) with the best lap from the next on-track session following our coaching (in red).
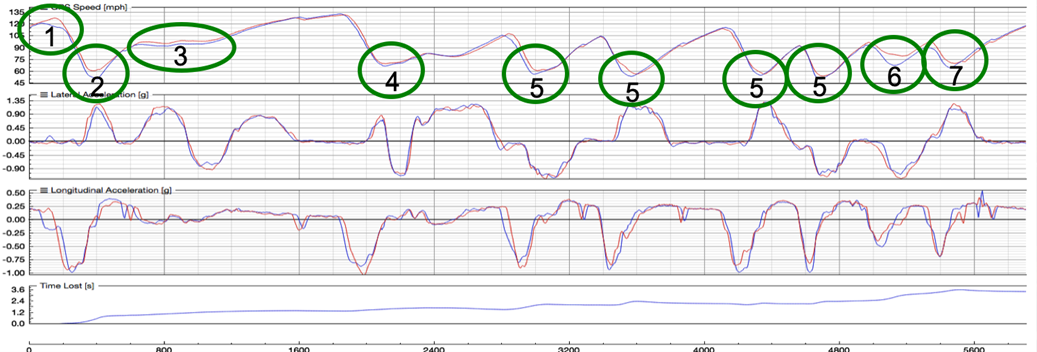
Let me zoom in on the Speed trace results to make it easier for you to notice the changes.
Look at those results:
- More speed — more throttle — approaching Turn 1
- Higher minimum speed in Turn 1 & better exit
- Higher speed in the Esses (2, 3)
- Slightly higher minimum speed in Bus Stop
- Better brake release in Turns 6, 7, 8, 9 — better entry speed, good exit
- Much higher speed between Turns 10 & 11
- Higher min speed (7 MPH more) in Turn 11 (exit speed not as good, but gave us something to work on for the next event)
All of this led to a lap time improvement of a little over 3 seconds! Yes, a 3-second improvement in one session from a driver who had been running similar lap times for years. And from focusing on only two things: spending more time at full throttle, and being aware of the brake release entering corners. The driver did it without me telling him specifically what to do; I had simply made him aware of a few things, then asked him to be more aware of two specific things while driving (the amount of time spent at full throttle, and the timing and rate of release of the brakes).
Can you use this same approach? You bet. Sure, it takes some experience of looking at the shape of the Speed trace to recognize what it should or shouldn’t look like, but it’s not difficult. If you just get in the habit of looking at the data trace after each session and ask yourself why the trace looks like it does – comparing it to how it felt when you drove — you’ll begin to notice trends.
Okay, let’s review the process. Focusing on the Speed trace:
- Look at acceleration/deceleration rate — are there places where you should be accelerating more, but you’re not?
- Any signs of coasting before braking?
- Could it be that you’re not at full throttle between turns?
- Are there signs of throttle lifts where they shouldn’t be?
- Are you trail braking enough in slow to mid-speed corners?
Then ask, “Why?” again. If you have other channels available (Lateral and Longitudinal g, throttle position, brake pressure, steering angle), try to confirm one way or the other if what you’re seeing is good or bad.
Notice that in this example I’ve only looked at one lap — the fastest lap. That can be dangerous because I might be missing some valuable information. So, it’s important to compare your fastest lap to three or four of your next fastest laps. What you may think is a trend may be a one-time issue. I also didn’t compare to another driver’s data. Sure, that’s the easiest way of finding speed, but it usually means you’re just copying, and that doesn’t lead to long-term learning and gains. In my example here, the driver then went on to use what he learned at Watkins Glen to make improvements at many other tracks. The learning was deep and long-lasting.
Finally, it’s easy to get defensive when looking at your data, but that doesn’t help. Instead, pretend you’re a detective, and look for your faults. You can’t improve if you don’t know what to improve.
Oh, and even if you don’t have data, you could use the two coaching strategies I suggested, and my experience says you’ll end up with a lap time improvement.
Ross Bentley
/////
Ross Bentley has spent a lifetime helping drivers go faster. He’s the author of the Speed Secrets books (the best-selling racing series ever), is one of the most sought-after driver coaches in the world, and runs SpeedSecrets.com, the largest collection of driver development resources anywhere. Want more articles like this? Subscribe at RossBentley.Substack.com.

P.S. – I used this same example (and many more) in the Data for Drivers webinar, so if you want more details, as well as more information about how to use data, you can watch the full session at https://SpeedSecrets.com/Webinars.